A wall-mounted e-ink dashboard that shows everything I need before leaving the house: weather, tram departures, commute times, waste collection days, and birthday reminders. It refreshes every 10 minutes during the day, slows down at night, and runs on battery for 3-4 months.
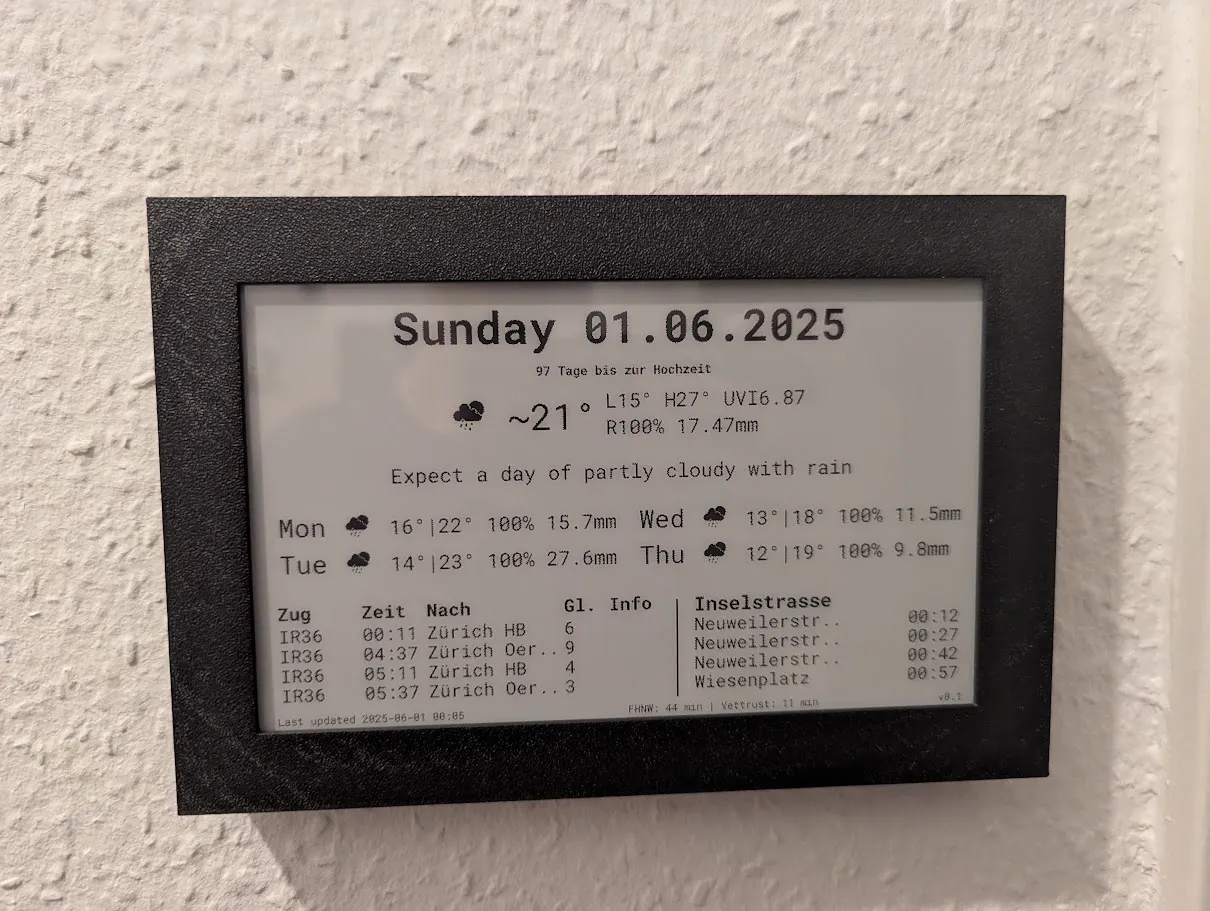
Older photo of e-ink display
Current layout: hourly temperature curve, warning bar, 4-day forecast chart, departures, commute and reminders
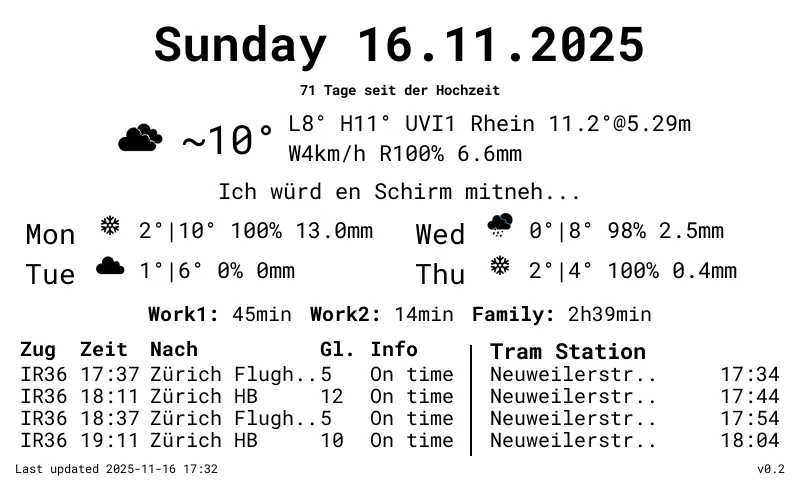
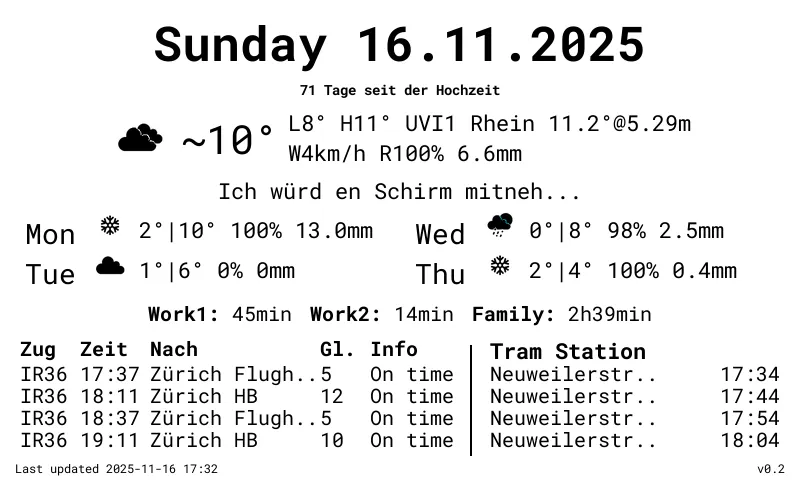
The earlier text-only layout, before the move to charts and panels
Motivation
I wanted something by the front door to glance at instead of checking my phone. E-ink fits well: it barely uses power, is always readable, and has no glare.
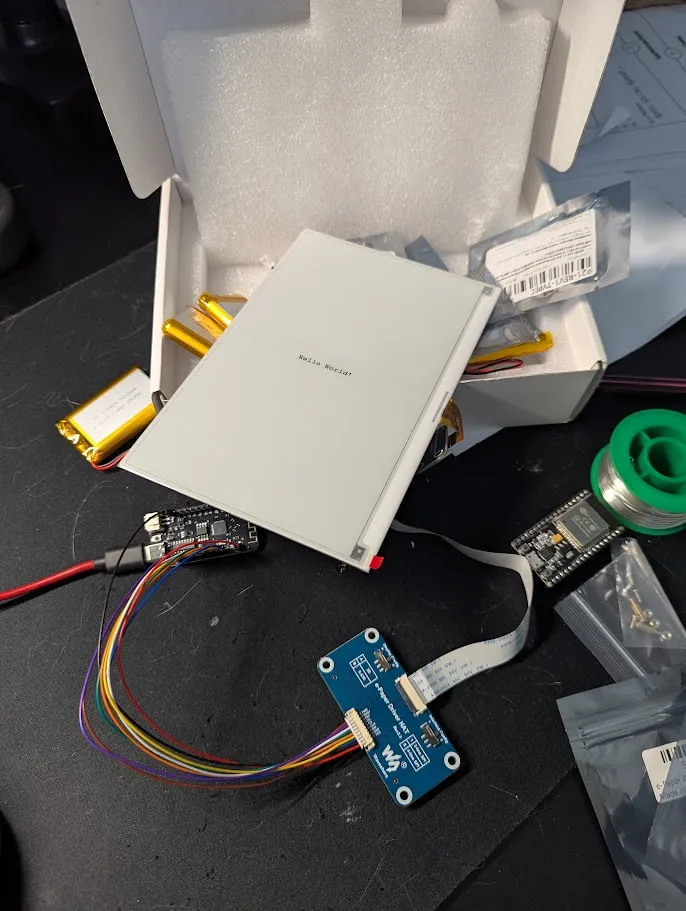
E-Ink Display first test
How It Works
A Python server renders the dashboard image, and an ESP32 downloads and displays it.
Server (Python):
- Fetches data from weather, transport, and river APIs
- Caches responses to minimize API calls
- Renders an 800x480 image using PIL/Pillow, including the temperature and forecast charts
- Converts to 1-bit BMP with Floyd-Steinberg dithering
- Serves the image via HTTP
Display (ESP32):
- Wakes from deep sleep every 10 minutes during the day, less often at night
- Downloads the latest image over WiFi
- Renders to the e-ink display
- Returns to deep sleep
This keeps the ESP32 firmware minimal: no API keys, no complex logic. I can update the dashboard layout by editing Python code without reflashing the hardware.
What It Shows
The layout went through a full redesign: the early version was a wall of text, the current one leans on small charts and dedicated panels.
- Header: Weekday and date, plus icons for the activities scheduled that day
- Now: Current and felt temperature, day min/max, UV index, sunshine duration, precipitation amount and probability, wind, and Rhine river temperature, water level and turbidity (FNU)
- Hourly curve: Temperature over the next 24 hours with sunset and sunrise markers, night hours shaded
- Warning bar: Weather warnings (e.g. heat warning level 3) and birthday reminders, only drawn when there is something to say
- 4-day forecast: Daily high/low as a line chart with precipitation amount and probability underneath
- Departures: Next trams per line and direction from the local stop (Swiss Transport API)
- Unterwegs: Live travel times to work and family (Google Maps)
- Termine: Waste collection days (household waste, paper), anniversaries and countdowns
- Footer: Last update, current refresh mode and next refresh time
Hardware
- Waveshare 7.5" e-ink display (800x480, black & white)
- ESP32 microcontroller
- 10,000mAh battery (3-4 months runtime)
- 3D-printed wall-mount case
- Linux server (Debian) running Python
Data Sources
- OpenWeatherMap: Weather forecasts
- Swiss Transport API: Train and tram schedules
- Google Distance Matrix: Travel time estimates
- Basel Open Data: Rhine river temperature, water level and turbidity
- Local waste collection calendar: Household waste and paper pickup days